Tier provides cities deep and live insights into how our mobility opportunities are used in the city. Cities can retrieve the data in multiple formats for different needs, all of which is machine readable to be used in their own data visualization and analysis tools.
🔑 You need to authenticate access our APIs, please ask your TIER contact for that!
There are multiple ways to share our mobility data and TIER provides it in both a common industry standard standardized and in a custom format tailored for TIERs usage patterns. You can use the one which fits your needs best.
Personally Identifiable Information (PII) and Data Safety
Sharing Data is great, but TIER takes great caution in only providing vehicle related data.
TIER takes data privacy seriously and is committed to safeguarding the privacy and security of personal data it collects from its users in accordance with the requirements set out in the General Data Protection Regulation (“GDPR”) and applicable national implementing legislation.
This also means that the cities themselves cannot get any PII from these data sharing endpoints, but can get all data about usage of our vehicles.
Furthermore TIER takes the protection of its users’ data extremely seriously. We are proud to report that our security systems and processes prevented us from having any known reportable breach in our company history so far and we are continuously working to improve them further.
Mobility Data Sharing Specification (MDS)
We share the ride data in a anonymized format, which is live and real-time for all completed trips. The data format is called MDS (mobility data sharing specification) which is a standard used by many cities across the earth.
💡 You will need IT personnel to automatically download and handle the live data as it comes in a machine readable format only!
Using this data you could
- Create Heat-Maps of now and the past
- Follow the location pattern of individual vehicles
- Aggregate Usage Pattern across the whole fleet over time
- See if and when vehicles were parked
- Much more
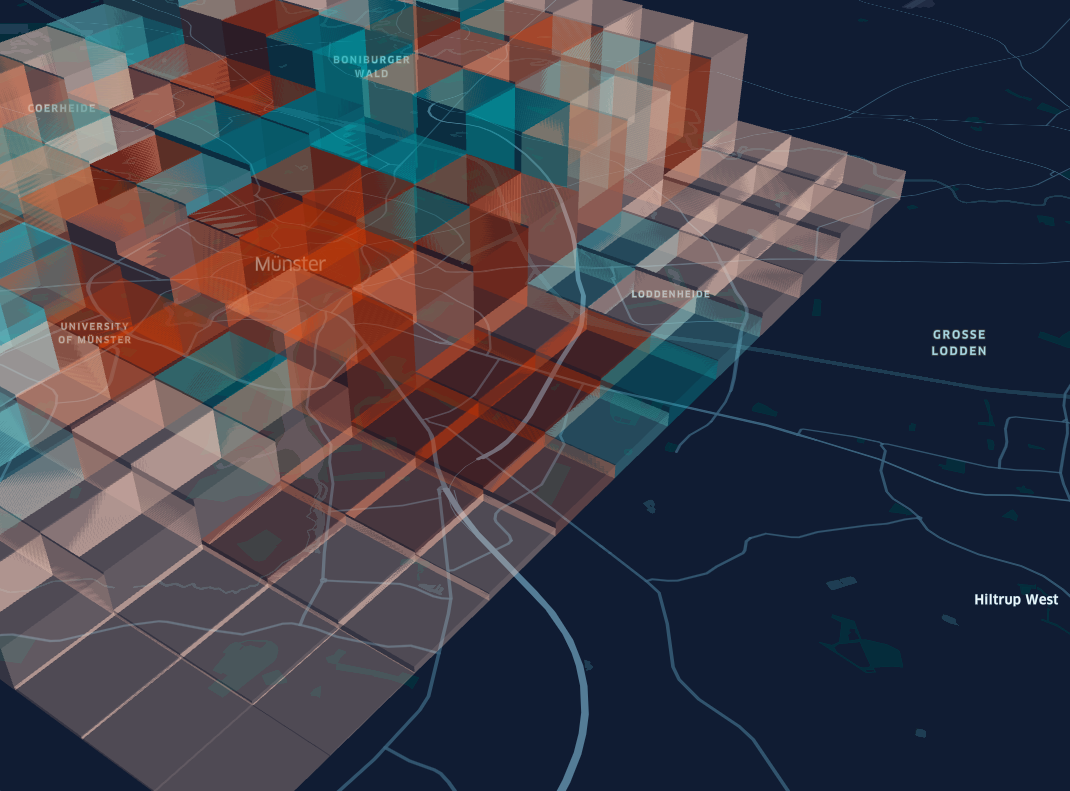 Example visualization that can be created using the data we provide
The documentation for the endpoint can be found here
View MDS 1.0 Data Sharing Documentation
TIER Vehicles & Zones
TIER also provides convenient endpoints to retrieve live data about all vehicles and all zones in which they are. These can be used to get live vehicle data and for example plot them on a map. You can also find out where parking zones have been set up and where our business area is.
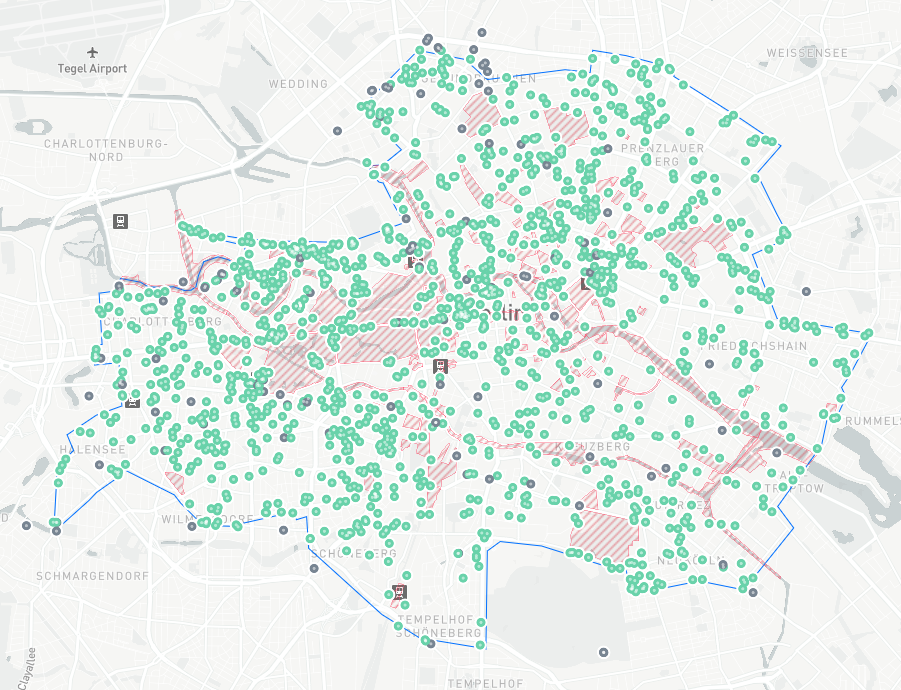 Using vehicle locations and zones, you can create visualizations like these
The documentation for the endpoints can be found here
Vehicles:
View API documentation for Vehicles
Zones: